Where we share some O&G news from beyond the Permian’s borders—news that, in some way, touches the Basin.
EIA
Feb. 25
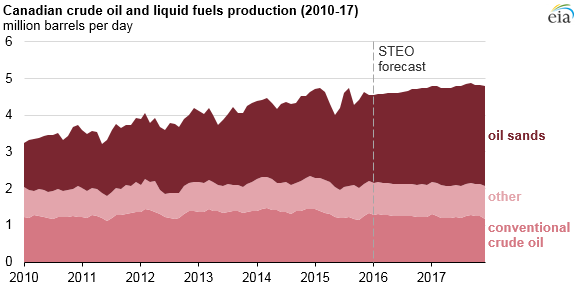
Despite lower crude oil prices, EIA expects Canadian oil production to continue increasing through 2017. Canadian oil sands projects that were already under construction when prices began to fall in 2014 and that are expected to begin production in the next two years are the main driver of production growth… According to EIA’s February Short-Term Energy Outlook, production of petroleum and other liquids in Canada, which totaled 4.5 million barrels per day (b/d) in 2015, is expected to average 4.6 million b/d in 2016 and 4.8 million b/d in 2017. This increase is driven by growth in oil sands production of about 300,000 b/d by the end of 2017, which is partially offset by a decline in conventional oil production.
Feb. 23
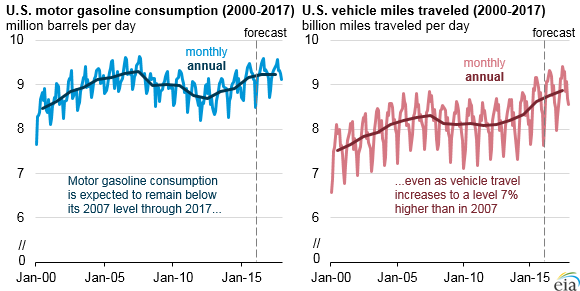
Based on estimates in the most recent Short-Term Energy Outlook (STEO), vehicle travel in the United States in 2015 was almost 4 percent above its 2007 level, but motor gasoline consumption has not exceeded its previous peak in 2007. Improvements in light-duty vehicle fuel economy are largely responsible for this outcome. STEO forecasts motor gasoline consumption to average 9.23 million barrels per day (b/d) in both 2016 and 2017, about 0.6 percent below its 2007 level. In contrast, vehicle travel is expected to grow to levels 5 percent and 7 percent above the 2007 level in 2016 and 2017, respectively.
Feb. 22
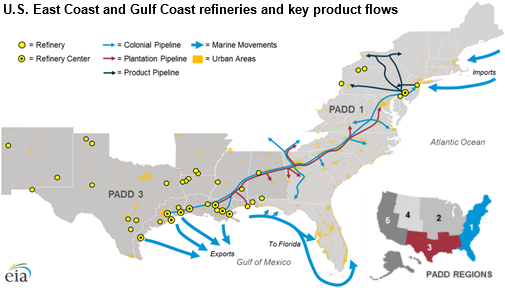
Two pipelines, the Colonial Pipeline and the Plantation Pipeline, typically operate at or near full capacity and in 2014 moved approximately 2.3 million barrels per day (b/d) of transportation fuels from the Gulf Coast to the East Coast. The Colonial system consists of 5,500 pipeline-miles and has connections to 29 refineries and 267 customer terminals. The Plantation system consists of 3,100 pipeline-miles and 36 pumping stations and has connections to 90 terminals at 34 delivery locations… An additional half-million b/d of transportation fuel is shipped from the Gulf Coast to the East Coast by coastwise-compliant tankers and barges, primarily to ports in Florida… Waterborne movements—both coastwise and internal river movements—connect supply and consumption centers between and within the Gulf Coast and East Coast regions.
Feb. 19
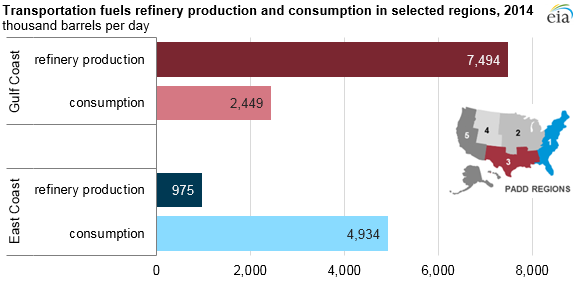
Movement of transportation fuels (motor gasoline, distillates, and jet fuel) between the U.S. Gulf Coast and East Coast regions represents the largest movement of such products in the United States. This relationship is underpinned by supply and demand imbalances in each region. The Gulf Coast is the largest petroleum-refining region in the country, making nearly half of total U.S. refined products. The densely populated East Coast is the largest consuming region in the country, accounting for more than one-third of total U.S. consumption of transportation fuels.
Feb. 18
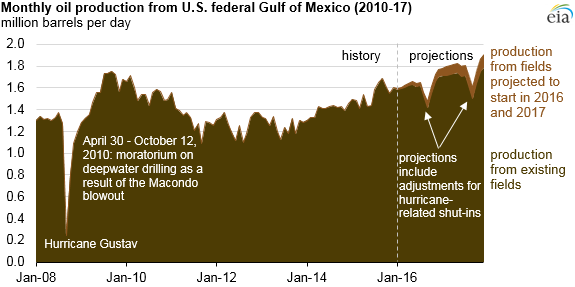
U.S. Gulf of Mexico (GOM) crude oil production is estimated to increase to record-high levels in 2017, even as oil prices remain low. EIA projects GOM production will average 1.63 million barrels per day (b/d) in 2016, and 1.79 million b/d in 2017, reaching 1.91 million b/d in December 2017. GOM production is expected to account for 18 percent and 21 percent of total forecast U.S. crude oil production in 2016 and 2017, respectively.
Feb. 17
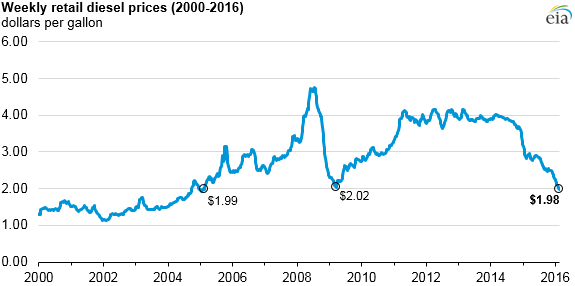
The U.S. Energy Information Administration’s (www.eia.gov) new “Today in Energy” brief looks at how the price of diesel fuel has dropped below $2 a gallon for the first time in 11 years.
“EIA’s weekly survey of diesel prices shows that the U.S. average retail price for on-highway diesel fuel was $1.98 per gallon (gal) on Feb. 15, falling below $2/gal for the first time since Feb. 14, 2005. The U.S. average retail diesel price had last approached, but not gone below, the $2.00 mark in early 2009. Falling diesel prices reflect both decreasing crude oil prices and increasing inventories of crude oil and refined products worldwide.
Feb. 12
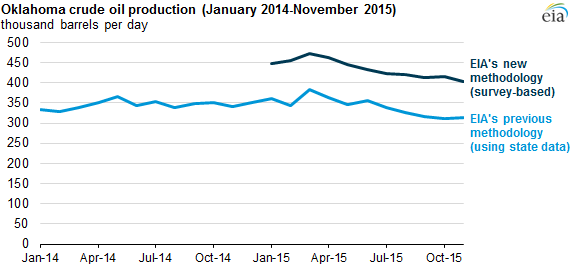
EIA’s Petroleum Supply Monthly, published on Jan. 30, includes crude oil production estimates for Oklahoma based on EIA monthly survey data. The new estimates are roughly 100,000 barrels per day more than those generated by the previous EIA methodology, which was informed by state-reported data.
Feb. 11
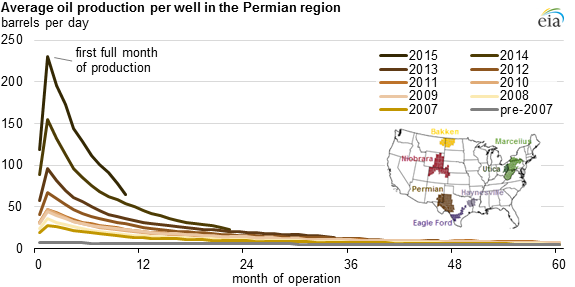
Tight oil production in the United States increased from 2007 through April 2015, based on estimates in EIA’s Drilling Productivity Report (DPR), and accounted for more than half of total U.S. oil production in 2015. Tight oil growth has been driven by increasing initial production rates from tight wells in regions analyzed in the DPR. As drilling techniques and technology improve, producers are able to extract more oil during the initial months of production from new wells.
Feb. 10
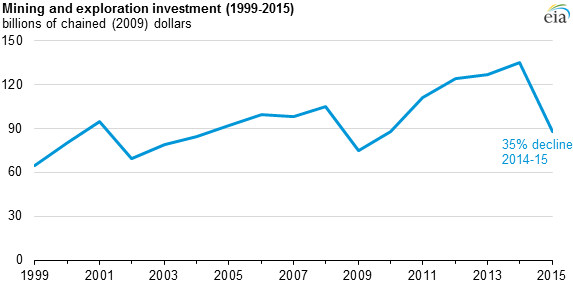
Mining and exploration investment declined 35 percent in 2015, the second largest year-over-year decline since the U.S. Bureau of Economic Analysis (BEA) began reporting the series in 1948. Most mining and exploration investment reflects petroleum exploration and development, but the category also includes natural gas, coal, and other minerals. Mining and exploration investment declined from $135 billion in 2014 to $87.7 billion in 2015, weighing down investment growth more than any other segment of nonresidential investment. Total private fixed investment, of which mining and exploration is a small subset, grew 4 percent in 2015 to $2.7 trillion. Low commodity prices remain a significant factor in U.S. firms’ investment decisions.
Feb. 9
U.S. Energy Information Administration Administrator Adam Sieminski issued the following comments on EIA’s February 2016 Short-Term Energy Outlook, which was released on Tuesday:
Crude Oil: Continuing increases in global oil inventories are expected to keep oil prices under $40 a barrel through August.
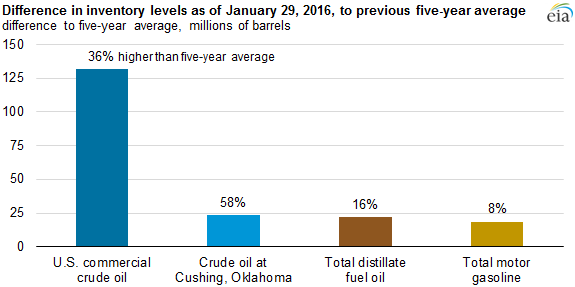
U.S. commercial inventories of crude oil reached nearly 503 million barrels at the end of January, marking the first time that oil stocks topped 500 million barrels since 1930.
Builds in oil inventories will continue, with U.S. crude stocks expected to peak this year at 517 million barrels in April.
Gasoline/Refined Products: For the first time since 2004, U.S. drivers are expected to pay an average of less than $2 a gallon for regular grade gasoline this year.
Lower crude oil prices, which have fallen more than 70 percent since the summer of 2014, are the main driver of cheaper gasoline prices.
Natural Gas:
Despite strong home heating demand during the recent East Coast blizzard, natural gas inventories are running 20 percent higher than a year ago and are on track to be above 2 trillion cubic feet at the end of the winter heating season for the first time in four years.
Electricity: Natural gas was used more than coal to generate electricity during the last six months of 2015 after having surpassed coal last April for the first time on record. However, rising natural gas prices are likely to discourage further increases in the use of the fuel for power generation during 2016.
Coal: U.S. coal production for January is estimated to be the lowest in more than 30 years, reflecting weak coal demand by the electric power sector.
Renewables: Utility-scale solar power generation is expected to increase 27 percent this year, while wind power grows 14 percent.
Feb. 4
Several factors have played a part in pushing U.S. crude oil prices below $30 per barrel (b), including high inventory levels of crude oil, uncertainty about global economic growth, volatility in equity and non-energy commodity markets, and the potential for additional crude oil supply to enter the market. Crude oil and petroleum product inventories, both domestically and internationally, have been growing since mid-2014 and are above five-year averages for this date.
PIRA
Week ending Feb. 22
U.S. Stocks Make New High
This past week’s inventory build pushed stocks to an all-time high. The crude surplus to last year has been narrowing as more of it is converted into products. The overall surplus to last year is about flat versus the beginning of the year, but the crude surplus is down 21 million barrels while the products surplus is up by a similar amount. Within products, the gasoline surplus versus the start of the year is up 21 million barrels, the distillate surplus is up 12 million barrels, while year-on-year surplus in the rest of the products is down 11 million barrels.
Low Oil Prices Strain PEMEX
U.S. gas exports into Mexico remain impressive early in 2016. Indeed, February exports are projected to again be near 3.4 BCF/D, ~1 BCF/D more than the prior year. These stout gains have been primarily facilitated by weaker domestic production and increased gas-fired electric generation—a trend that should continue well into this year. PIRA’s Reference Case calls for exports to average ~3.6 BCF/D in 2016, which would mark yet another record-breaking year.
Takes from E-world in Essen
This issue of plant retirements was brought up in several of PIRA’s discussions during E-world, with concerns that even some lignite units may be shut down. We have noted in our prior EES scorecard that daily average lignite output declined substantially over the past 30 days, as day-ahead prices moved lower. So far, with average daily data from Jan. 1, 2016, we want to note that lignite output moved down to about 11.2 GWs, as day-ahead prices settled at €12/MWh on Jan. 30, equivalent to a loss of 7.5 GWs.
Colombian Strike Risk Buoys Coal
The coal market rebounded notably last week, with API #2 (Northwest Europe) and API #4 (South Africa) prices recording similarly strong gains at the front of the curve, while FOB Newcastle (Australia) price increases were more subdued. A modest rebound in oil/gas pricing provided some of the updrafts for coal pricing, although a growing likelihood of a labor strike at the Cerrejón mine in Colombia gave Atlantic Basin pricing the extra amount of stimulus. In the Pacific Basin, a reduction in Australia’s thermal coal exports in December/January, coupled with news that Anglo American is looking to divest its coal assets globally, is showing that pressures to curtail coal supply are becoming more binding.
Indian LPG Imports Set to Drop
India’s domestic LPG production is jumping a step change higher as the Indian Oil Corporation inaugurates its eighth refinery in Paradip on the east coast. The refinery includes a one-of-a-kind heavy oil-to-LPG conversion unit that is ramping to a production capacity of 1 million MT of LPG/year. Indian LPG production is climbing 11 percent higher this year as a result of Paradip’s startup, effectively backing out 24 VLGC cargo imports/year.
Global Equities Stage Strong Rebound
Global equities posted solid and broad gains on the week. In the United States, all of the tracking indices gained ground, with the retail, consumer discretionary, housing, and technology indices outperforming. Internationally, all the tracking indices also gained. The best performers were China, the other BRICs, Emerging Asia, and Japan.
Ethanol Stocks Soar
U.S. ethanol inventories set another record last week, building by 262 thousand barrels to 23.2 million barrels. Ethanol production increased for the second consecutive week, rising to a four-week high 975 MB/D.
“Clean Power Plan’s” Survival?
With the recent unexpected passing of Supreme Court Justice Antonin Scalia, the chances that EPA’s “Clean Power Plan” will survive legal review have improved. The 5-4 decision to stay the CPP last week indicated the Court would likely strike down the rule. With the current court split 4-4, the identity of that last justice is critical to the prospects of the CPP and may not be determined until after the 2016 elections. In the event the CPP is ultimately upheld by the Supreme Court, we would expect EPA to toll the CPP’s deadlines for both filing SIPs and compliance by roughly two to three years.
Japanese Crude Imports Fell
Crude runs showed very little change on the week. Crude imports fell back, and on balance, crude stocks moved up fractionally. Finished products drew 2.4 MMBbls with almost half the decline in kerosene. Gasoline, gasoil, jet-kero, and fuel oil demands all fell back, but stocks still drew to varying degrees. Major product demand was lower on the week, but it continued rising slightly on a trend basis. Margins have softened in January and into February, but on the week were slightly higher.
Can Europe Cope with LNG Market?
With winter nearing an end, is it still worth staying short? The answer looks to be yes. Even though spot prices have come down by 8 percent M/M and by 16 percent quarter-on-quarter, prices can still go lower. As always, significant risks remain in place, especially as we enter the summer period, when injection accounts for over 20 percent of what happens to supply.
Stress Eases this Week
Financial stress appears to have eased up a bit this week. The S&P 500 rose Friday-to-Friday and on a weekly average basis. All of the other indicators, such as volatility, high-yield debt, and emerging market debt, also staged varying degrees of improvement. The U.S. dollar has been increasingly mixed. Commodities ex-energy are looking marginally better. The Cleveland Fed released its inflation expectations for February, which showed a ratcheting down across all time frames.
U.S. Ethanol Prices Fall
Record-high inventories and lower oil values drove ethanol prices to a three-week low last week. High demand on the export market prevented sharper declines, though prices are expected to fall further in upcoming weeks. Manufacturing margins were up slightly last week, but they were trending downward by the weekend.
Energy Spending To Hit Record Low
U.S. consumer spending on energy will soon hit a record low as a share of total consumer expenditures. Variations in the consumer energy-spending share have been largely driven by oil prices, and the decline in retail gasoline prices should push the share below 3.5 percent this quarter. As consumers have spent less of their budget on energy goods and services, they have spent more on healthcare goods and services and in restaurants. As oil prices start to recover later in 2016, as PIRA projects, these industries may well face headwinds as the share of consumer spending on energy increases.
End to Heating Season Already in Sight
The mild-weather forecasts weighing on gas prices are reinforcing perceptions of an “early end” to the heating season. As it now stands, the next EIA weekly storage report is likely to feature the last triple-digit withdrawal of this heating season. While the books have not yet closed on February, PIRA’s balances are coalescing around an end-month storage position of ~2.48 TCF, which would yield a year-on-year surplus of ~840 BCF. Consequently, March is front and center.
The Good, the Bad, and the Potentially Ugly
Recent U.S. data releases on manufacturing, jobs, consumer spending, and housing have been encouraging and pointed to acceleration in economic activity during the first quarter. Business investment, on the other hand, may experience a contraction in the near term. A firmer-than-expected inflation reading for January is likely to embolden hawkish members of the Federal Reserve policy committee.
Japan’s SPR Will Be Drawn Down
The Japanese government released a new proposal about the management of its strategic petroleum reserve. A government stock sale of at least 20 MB/D on average over the next four years is in store, since the current official reserve level is elevated according to the new rule. Separately, the draft recommended an expansion of government storage for LPG by 4.2 MMB in the next two years, based on the positive demand outlook for the fuel.
UK Will See Lower Gas Prices
British firms can expect to see their energy bills fall by between 10-20 percent this summer as turmoil in the oil market pays dividends for customers. The wholesale cost of gas on the UK market has plummeted by more than 40 percent in the last year due to a global oversupply and depressed oil prices. The weaker gas price has also caused wholesale electricity prices to slump by more than 30 percent, because a large amount of the UK’s power network is gas fired.
Asian Demand : Growth to Slow
PIRA’s latest update of Asian product demand shows continued slowing. PIRA’s January update had shown growth of 741 MB/D, down from over 1 MMB/D in the December update. The latest average three-month data indicate growth of only 294 MB/D. Looking at the upside, India and Korean growth is still good at 335 MB/D and 179 MB/D (vs. 396 MB/D and 154 MB/D last month). A weak performance was registered by China with growth of only 48 MB/D (255 MB/D last month), while Japan now posts a decline of -274 MB/D (-98 MB/D last month). The current growth assessment for Asia picks up preliminary January data on China and India and full 4Q15 data for all the other countries other than Thailand. Looking at individual products, gasoline accounts for 223 MB/D of the growth, but down from growth of 308 MB/D in our last assessment. Weakness continues in middle distillate demand performance, both gasoil and jet-kero. Asian gasoil demand growth is now 77 MB/D, down from 149 MB/D last month, while Asian jet-kero demand growth has also slowed.
AB Supply Glut Concerns
The specter of JKM dipping below NBP in the coming months looms large, particularly as Japan appears to be contemplating the restart of Tepco’s Kashiwazaki-Kariwa (KK) nuclear facility. It is highly unlikely that such a thing would happen this year; in fact, any restart at KK is not built into the PIRA nuclear forecast in Japan at all at this point, owing to the very high political hurdles that are in place for Tepco in particular. But the fact that it is now on the table is worrisome for Asian gas consumption.
Rising U.S. VMT Growth
Since mid-2013, growth in U.S. vehicle miles traveled has displayed accelerating growth. Even with that growth, the pace has been below what traditionally has occurred out of a deep recession and compared to what PIRA’s modeling efforts would indicate. In the most recent VMT data, year-on-year gains remain robust, up over 4 percent in November. The good year-on-year growth in VMT, seen in the most recent data for 2015, helps explain the strong gasoline demand that has been witnessed. For 2015, PIRA estimates gasoline demand grew 2.5 percent, or 227 MB/D, the strongest since 2002, when year-on-year growth was 2.8 percent, or 238 MB/D.
Competition for Product Exports to Australia
Australia has emerged as a major importer of refined products in the Asia-Pacific region over the past few years due to refinery closures there. Net imports more than doubled from some 233 MB/D in 2010 to about 506 MB/D last year, led by diesel, gasoline, and jet fuel. Competition is heating up among exporters to supply Australia, with China and India entering the market Down Under. But Australia’s imports of refined products are expected to only increase slowly from here due to relatively slow demand growth, unless there are more refinery closures, and none are currently expected. Australia alone will not correct the surplus of refined product production capacity in Asia-Pacific.
Platts U.S. Natural Gas Production Rises
Natural gas production in the lower 48 United States averaged 71.5 billion cubic feet per day (Bcf/d) in January, which is up nearly 0.5 Bcf/d, compared to the December average, according to Platts Bentek, an analytics and forecasting unit of Platts, the leading independent provider of information and benchmark prices for the commodities and energy. On a month-over-month basis, January natural gas production was up less than 1 percent from December.
The U.S. Energy Information Administration (EIA) was to publish its domestic production estimates for September on or around Feb. 29.
“The growth observed in the January-over-December was the culmination of relatively large movements in production across several regions,” said Sami Yahya, Platts Bentek energy analyst. “The Northeast predictably was responsible for the largest shift, increasing by about 750 million cubic feet (MMcf/d) in January over the previous month. Production average in the Midcon basin jumped by nearly 350 MMcf/d, which was countered by a drop of 360 MMcf/d and 100 MMcf/d in the Southeast and Texas, respectively. Production in the Midwest and Southwest regions dipped by 75 MMcf/d each, while the Rockies remained flat month-on-month. ”
The growth spurt in the Northeast was partially a recovery from a dip caused by lower-than-normal demand that took place in late December. Northeast production was curtailed by an average of 0.5 Bcf/d during the last week of December, as warmer temperatures blanketed the region and suppressed demand. The other reason for the growth spurt is the commencement of Transco’s Leidy Southeast expansion on Jan. 5, providing 525 MMcf/d of capacity from the Dry Marcellus in northeastern Pennsylvania to as far as Choctaw, Ala. Northeast production managed a new record of 22.5 Bcf/d in late January.
There was little to no effect from freeze-offs this winter season in the Northeast, which is in contrast with past winter seasons, said Yahya.
“As the 2015 fourth quarter results trickle out over the next few weeks, and we learn more about the 2016 guidance, the primary theme among producers will likely be that of unrelenting perseverance,” Yahya said. “The number of active rigs in the country continues to slide, and more budget cuts are expected. Slowing down drilling programs or even halting them is anything but a losing bet, and relying heavily on the availability of wells in backlog inventory is in the cards. Producers will need to raise capital to complete whatever backlog of wells they have, and thus selling some non-core assets is also a big possibility for many of the operators.”
The latest Platts Bentek data analysis suggests 2016 U.S. natural gas production will average approximately 71.7 Bcf/d, with some growth geared toward the end of the year. This will mark a year-on-year growth of less than 1 percent.
The Platts Bentek data analysis is based on an extensive sample of near real-time production receipt data from the U.S. lower 48 interstate pipeline system. Platts Bentek production models are highly correlated with and provide an advance glimpse of federal government statistics from the U.S. EIA.
This Platts Bentek U.S. natural gas production data estimate will be published every month covering the previous month’s output activity. The Platts Bentek dry gas production estimates are not observed data, but rather, they are based on pipeline receipt nominations and certain state production data.
Bentek Energy, which specializes in energy market analytics and is recognized as the industry leader in natural gas market fundamental analysis was acquired by Platts in 2011, and is known as Platts Bentek. For more information about natural gas supply and demand fundamentals and Platts Bentek, visit the website at www.platts.com.
New Price References for On-Ship Crude
To bring transparency to the U.S. export value of crude oil on the U.S. Gulf Coast, Platts announced on Feb. 5 it will publish new pricing points for light sweet crude oil and condensates free-on-board ship from Houston and Corpus Christi, Texas, and a new pricing point for Canadian heavy crude oil delivered to the U.S. Gulf Coast. The new price assessments were published on Feb. 8. 2016.
“The lifting of the 40-year-old restrictions on the exportation of U.S. oil is an historic event and we’re proud to offer the marketplace new pricing references that reflect for the first time, the on-ship value of exportable U.S. crude oil,” said Dave Ernsberger, global editorial director of oil at Platts, the leading independent provider of information and benchmark prices for the commodities and energy markets.
The new Platts price assessments, listed below, will reflect the open market value of light sweet crude, West Texas Intermediate (WTI), and Eagle Ford crude and condensates, free on-board, 600,000-barrel-size cargo ships at Houston and Corpus Christi, Texas. The assessments will be assessed as an outright price in U.S. dollars per barrel and also assessed as a differential to WTI.
Additionally, Platts assessment of WCS at Nederland terminal will reflect value of the growing volume of Canadian heavy crude oil shipped via pipeline to U.S. Gulf Coast terminals and refineries.
The new assessments:
- Platts WTI Houston (FOB)
- Platts Eagle Ford Crude Houston
- Platts Eagle Ford Condensate Houston
- Platts Eagle Ford Crude Corpus Christi
- Platts Eagle Ford Condensate Corpus Christi
- Platts WCS Nederland
“The freedom to export is giving rise to market interest not only in the oils produced from key shale basins, particularly the Permian and Eagle Ford basins in Texas, but also to oil produced in Western Canada and piped to the Gulf,” said Luciano Battistini, managing editor of crude oil pricing in the Americas. “We expect the energy industry and investor communities to pay particular attention to a number of select pipelines, Gulf-based storage terminals, refineries, and ports going forward.”
Separately, as announced Jan. 26, 2016, by subscriber note, Platts is in process of gathering market feedback regarding the appropriateness of the 3:15 p.m. ET closing time of its price assessment process for U.S. oil and associated markets. The consultation runs until Feb, 21, 2016.
The U.S. crude oil export price assessments augment Platts’ existing suite of physical market price references designed to reflect crude oil developments in the Houston area, including the Platts WTI MEH (East Houston), launched in early 2015, and Platts Light Houston Sweet (LHS) assessment, launched in July 2013, representing the value of oil delivered not only from Magellan East Houston terminal but also from the Enterprise Crude Houston (ECHO) and Oiltanking Houston (OTI) terminals.
The Platts export-value oil assessments are built on the Platts Market-on-Close (MOC) methodology, a structured, highly transparent price assessment process based on the principle that price is a function of time. The MOC process in oil identifies bid, offer, and transaction data by company and results in a time-sensitive, end-of-trading-day daily price assessment. For more information, visit this methodology and specification page of the Platts website.
The U.S. export value assessments will be published in real-time service Platts Global Alert, as well as Platts Crude Oil Marketwire, Platts Oilgram Price Report and Platts North American Crude and Products Scan.
For more information on oil visit the Platts website at www.platts.com.


