EIA
Mar. 30
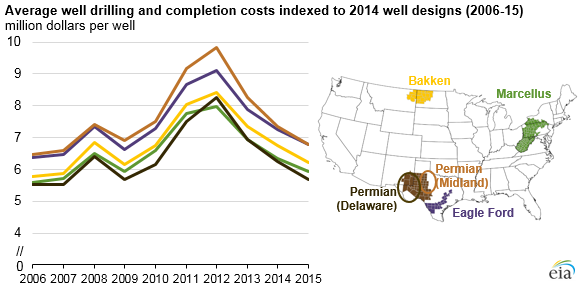
The profitability of oil and natural gas development activity depends on both the prices realized by producers and the cost and productivity of newly developed wells… Costs per well generally increased from 2006 to 2012, demonstrating the effect of rapid growth in drilling activity. Since 2012, costs per well have decreased because of reduced overall drilling activity and improved drilling efficiency and tools. Changes in costs and well parameters, such as the need to drill deeper or longer lateral wells, have affected the onshore oil plays differently in 2015, with recent per-well costs ranging from 7 percent to 22 percent below 2014 levels.
Mar. 28
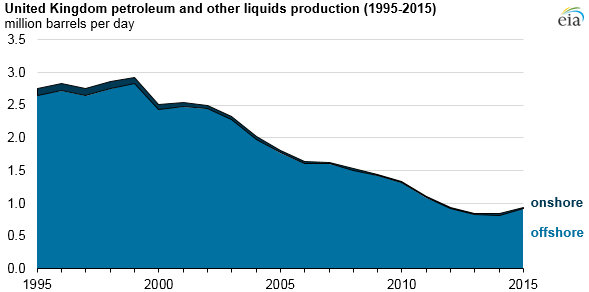
After many years of decline, production of petroleum and other liquids in the United Kingdom (U.K.) increased by about 100,000 barrels per day (b/d) in 2015. The largest contribution to this increase came from fields that were brought online in the second half of 2014. Significant increases also came from fields that came online in 2015, and from improved performance of the U.K.’s largest producing field, the offshore Buzzard field. A similar year-over-year increase in production volumes hasn’t occurred since 1998, when petroleum and other liquids production grew by slightly more than 100,000 b/d.
Mar. 23
The U.S. Energy Information Administration released a report that looks at trends in U.S. oil and natural gas upstream costs. Among the report’s key findings are:
- The average well drilling and completion costs in five onshore areas evaluated in 2015 were between 25 percent and 30 percent below their level in 2012, when costs per well were at their highest point over the past decade.
- Based on expectations of continuing oversupply of global oil in 2016, the report foresees a continued downward trajectory in costs as drilling activity declines. For example, the report expects rig rates to fall by 5 percent to 10 percent in 2016 with increases of 5 percent in 2017 and 2018.
- The report also expects additional efficiencies in drilling rates, lateral lengths, proppant use, multi-well pads, and number of stages that will further drive down costs measured in terms of dollars per barrel of oil-equivalent ($/boe) by 7 percent to 22 percent over this period.
Mar. 22
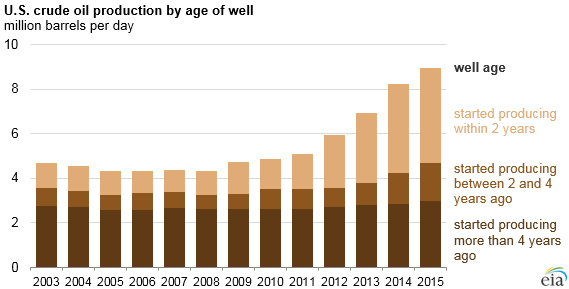
U.S. crude oil production from the Lower 48 states from new wells (drilled since the start of 2014) made up 48 percent of total U.S. crude oil production in 2015, up from 22 percent in 2007. Production from new wells has grown as advances in horizontal drilling and completion techniques led to growth in oil production from low-permeability tight reservoirs. In 2015, production from tight formations—which include, but are not limited to, shale plays—accounted for more than 4 million barrels per day (b/d), or 50 percent of total U.S. oil production.
Mar. 15
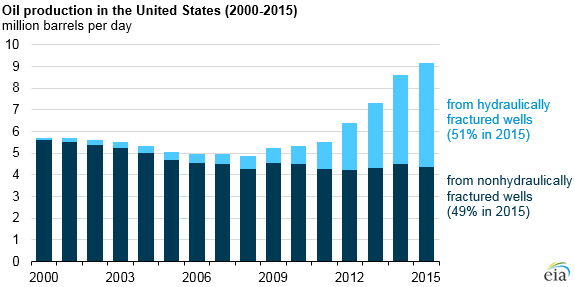
Using well completion and production data from DrillingInfo and IHS Global Insight, EIA created a profile of oil production in the United States. In 2000, approximately 23,000 hydraulically fractured wells produced 102,000 barrels per day (b/d) of oil in the United States, making up less than 2 percent of the national total. By 2015, the number of hydraulically fractured wells grew to an estimated 300,000, and production from those wells had grown to more than 4.3 million b/d, making up about 50 percent of the total oil output of the United States. These results may vary from other sources because of the types of wells included in the analysis and update schedules of source databases.
PIRA
Week ending Feb. 29
Asia Continues to Drive Global Oil Demand Growth
Oil markets remain structurally weak for the near term due to turnarounds and as Iranian crude oil exports increase and will take time to rebalance. Asia continues to drive global oil demand growth despite the economic slowdown in China. Asian refinery runs will increase this year with capacity expansions and higher runs in Chinese “tea kettle” refineries. Gasoline cracks will continue to outperform diesel cracks this year.
Gas Prices Collapse Under Outsized Storage Inventories
After briefly breeching the former low set in late December, the NYMEX nearby contract went off the board at ~$1.71/MMBtu—setting the stage for a March Henry Hub Bidweek price that will be ~50¢ below February and also marking a low for the benchmark not seen since March 1999. Much is riding on the demand and supply response to such prices considering the fallout on U.S. and Canadian storage tied to the collapse in heating loads during February. The South Central will account for ~50 percent of this month’s overall expansion in the year-on-year U.S. storage surplus. The resulting end-February overhang is clearly an impediment standing in the way of a near-term price recovery, especially after considering the South’s increased exposure to Appalachia supply tied to pipeline capacity additions between the regions. Still, given the lack of any draw last March, that surplus is likely to start to contract. Moreover, the acute price weakness now in effect also stands to accelerate U.S. production weakness — even in Appalachian.
February Blows Warm and Is Gone with the Wind
German forward prices are no longer allowing the most efficient coal units to fully recover their fuel, transportation, and carbon costs. Hedging strategies are in part to blame, as power generators continue to sell to secure cash. French prices are more likely to firm, as France will see a heavier nuclear outage schedule this year, while draconian cost cutting measures will undermine nuclear output. Italian prices have been undermined by improving hydro (not only in Italy itself, but also Alpine region) and higher imports from both France and Switzerland. 3Q contract is trading with a €2-3/MWh risk premium.
Coal Pricing Mixed Despite Stronger Oil Market
A general increase in oil pricing helped give the coal market a lift, although API#2 (Northwest Europe) prices actually lost ground last week. API#2 gave back some, but not all, of the sizeable gains made last week when the market surged on labor strike risk from Colombia. In the Pacific, some signs of stabilization in China’s buying activity along with the rise in oil prices allowed API#4 (South Africa) and FOB Newcastle (Australia) to rise modestly. PIRA continues to believe that API#4 prices remain too strong relative to FOB Newcastle, and we expect more downside for API#4 over the next 90 days, barring unforeseen supply disruptions.
California Carbon Auctions Undersubscribed
With CA/QC allowance prices having fallen below the auction floor in the secondary market, auction results released today indicate both the current and future vintage auctions were undersubscribed—a first for California. Demand was more than sufficient to allow for the sale of all allowances consigned to auction on behalf of CA entities. Unsold allowances will be offered at future auctions—generally when/if auction pricing exceeds the reserve price for two consecutive auctions.
Production Rises, Stocks Fall
U.S. ethanol production has increased for three consecutive weeks, reaching 994 MB/D, the fifth highest level ever reported. Ethanol inventories dropped from a record high in the previous week, falling by 113 thousand barrels to 23.1 million barrels.
Pressure Continues
Late Friday afternoon saw the wheat short set a record in one COT category while Nidera registered 227 new certificates for delivery against the March soybean contract. No wonder that SRW made a new low last week while soybeans had five losing days in a row.
Depreciation Offsetting Some Benefits of Low Crude Prices
PIRA’s analysis of retail fuel prices around the world shows that the decline in fuel prices is not keeping pace with that of Brent. On a demand-weighted average basis, we estimate that global gasoline and diesel prices are down 40 percent from July 2014 to January 2016 in U.S. dollar terms, compared to Brent’s 70 percent fall. Part of the discrepancy can be attributed to subsidy and pricing reforms, fixed taxes, relatively stable downstream margins, and tight gasoline supplies in some locations. But currency depreciation is also having a notable impact. Gasoline and diesel prices in local currency terms are down less than 30 percent over the period. We estimate that currency weakness versus the dollar is offsetting roughly a third of the price benefit of low crude prices for local consumers. Even so, realized fuel price declines are still substantial and, in our view, will continue to support global oil demand this year.
Financial Stress Eases
Financial stresses eased again this past week. For the second straight week, the S&P 500 rose Friday-to-Friday and on a weekly average basis. All of the other indicators, such as volatility, high-yield debt and emerging market debt, also staged varying degrees of improvement. The U.S. dollar has been increasingly mixed. Debate on a U.K. withdrawal from the EU has fed weakness in sterling. Commodities ex-energy are looking significantly better the last several weeks.
Gasoline Cracks Will Strengthen
Growing crude stocks continue to weigh on Brent structure for the next few months, but fundamentals are starting to improve. Gasoline strength will return and will outperform diesel, partially echoing 2015. Product stock levels grow, but not uniformly as refiners shift yields from middle distillates toward gasoline. Refining margins will recover from recent decline and stay generally healthy, and runs stay reasonably high through the summer before weakening.
North American Gas Forecast Monthly
North American gas market fundamentals have assumed a much less bullish posture, starting with an end-March storage carryout now expected to be within striking distance of 2.3 TCF, ~0.2 TCF above our month-earlier Reference Case. A collapse of February gas-weighted heating degree-days relative to normal was the principal cause, but other factors have played a role. Production, led by Appalachian Basin, has made a strong recovery of late, fostering doubts about a near-term Lower 48 rollover. PIRA’s Reference Case sees limited marketing opportunities and capital spending, making the region’s growth prospects even more vulnerable. Sequentially stronger western Canadian gas production of late, coupled with unusually flush inventories, also poses a greater perceived supply side threat to tighter U.S. gas balances.
European LPG Prices Pulled Higher by Broader Markets
European LPG prices firmed, but mostly due to the strength in crude and naphtha prices and not as a result of a tightening supply and demand situation. The region remains well supplied, particularly as larger fully refrigerated cargoes are now loading in Marcus Hook, Pa., and will be increasingly pointed at the region due to proximity. March propane futures added $22/MT to $256/MT, while cash butane cargoes were called a somewhat narrow $20 higher.
Outlook Forum Mission Accomplished
On paper, the USDA was able to keep carry-outs below 2 billion, 500 million, and 1 billion, its goal going into the Outlook Forum. The question remains, however, can it last? Without a major weather disruption during the upcoming growing season, prospects for a price recovery seem bleak.
U.S. Ethanol Prices Increase
Ethanol prices rose last week despite record inventories. Manufacturing margins were steady and sufficient for most plants to operate at high rates.
Global Equities Post Another Positive Week
Global equities posted a second straight week of gains, rising 1.1 percent. The Americas continue to outperform. In the United States, almost all the tracking indices were higher on the week. Retail, housing, and materials all outperformed, while utilities lagged and were neutral on the week. Internationally, the tracking indices were more mixed. Japan, Latin America, and BRICs all outperformed.
Dry Bulk Shipping Market in Crisis Mode
Last month, we discussed the unprecedented collapse in dry bulk freight rates highlighting the breadth, speed, and extent of the rate declines. It is much the same story this month. Hopes that the Chinese, on returning to work after their Lunar New Year holidays, would provide some market momentum have been all but dashed. While Chinese economic data have been delayed by the holidays, the dry bulk freight market has provided its own measure on China’s faltering physical demand for raw materials and it remains ugly. As hopes of a demand-led shipping recovery dwindle, the focus is shifting to supply-side responses. The sheer scale of the dry bulk-shipping crisis is starting to have some significant consequences.
U.S. Commercial Stocks Draw
Strong product demand was reflected in a product stocks draw for the week of February 19, while lower crude runs contributed to a crude stock build. This build in crude stocks occurred in spite of mounting evidence that the pace of declines in domestic crude supply has quickened. Gasoline production has begun to transition to a lower RVP content, and this will be reflected by lower butane use and lower gasoline yield. Next week we expect flat crude runs to contribute to another crude stock build, but low runs also contribute to product stock draws.
The Tug of Oil and the Weight of Supply/Demand
Gas is continuing its search for demand as it sets to enter the last month of the winter. February has been another warm month across major gas-consuming markets in Europe. Temperatures are up significantly over last month and are quite high historically.
California Allowances Can Be a Cash Source
California carbon allowance prices dropped dramatically, crashing through the auction floor, indicating expectations that the current vintage auction was undersubscribed—a first for California. Environmental commodity markets well beyond California have also been sliding over the past two months. For California carbon, financially challenged oil producers that receive free allowance allocations but do not face immediate allowance surrender requirements could sell allowances to raise cash, in turn boosting near-term supply—a phenomenon observed in the EU ETS in the past.
Japanese Crude; Imports Fell and Stocks Drew
Crude runs showed very little change for the second straight week. Imports fell back and stocks posted a draw. Finished product stocks drew due to declines in naphtha, fuel oil, and jet-kero, more than offsetting lesser builds in gasoline and gasoil. Demands were broadly lower and considered soft. Margins continued to weaken, extending their decline from peak December levels.
UnitedStates Can’t Carry World Economy Alone
U.S. economic growth is picking up pace, powered by strengthening consumer spending. GDP growth for the fourth quarter was revised up, and households significantly increased their spending during January. Manufacturing-related activity data (such as industrial production and durable goods orders) were constructive in January. But based on a historical pattern, the U.S. strength is probably not sufficient by itself to lift the slumping global manufacturing sector. Important economic events pack the calendar for the next few weeks.
U.S. Exports Debut Amid Unstable Arbitrage Outlook
The recent plunge in Henry Hub prices, combined with some support for NBP prices at current levels, has made this U.S.-Europe trade look quite appealing—so appealing that it is hard to make a case for the U.S. LNG to go anywhere else other than to South America, which is typically looking at paying the netback equivalent that would be captured by sending the cargoes to Europe. Europe also has several buyers in the Mediterranean gauging the relative value of LNG versus oil-indexed prices.
Gulf of Mexico; Short-Term Resilience, Medium-Term Weakness
Gulf of Mexico crude production has grown at a 7 percent CAGR since 2012 and is expected to continue to grow at this pace until 2017. The resilience is the result of the ramp-up of recent projects and the start-up of new projects already under construction. However, low prices will have medium-term impacts as project sanctioning has slowed, causing few projects to come online in the 2018-2020 period. PIRA expects GOM crude production to grow from 1,550 MB/D in 2015 to 1,800 MB/D in 2017, then decline by 200 MB/D to 1,600 MB/D in 2020. Longer term, we expect production to breach its 2017 highs by 2023 as projects currently in the appraisal/definition stage come online.
Supply Growth Becomes Increasingly Unaffordable
While March signals the approaching official end of the heating season, the dearth of degree days in February has seemingly convinced the market that the winter has already concluded—given the improbability of clearing excess seasonal inventories. Thursday’s extraordinarily light 117 BCF draw, relative to expectations pinned ~20 BCF higher, likely represents the final triple-digit draw of the season. The fundamentals for the week-in-progress suggest that withdrawals have plummeted to a historically bearish seasonal level in the low-30s, with only three other sub-40 weekly readings ever recorded in February (1995, 2006, and 2009). Thereafter, milder weather and the transition to spring will significantly limit the call on storage through end-March.
Oil Substitution Re-Enters the Debate
PIRA sees every reason for the deterioration of bids in Asian spot markets to continue in the month ahead. Regional gas markets will be entering the lowest period of the year for seasonal gas demand and, additional LNG supply from Gladstone, APLNG, and Gorgon is scheduled to emerge from Australia alone. Buyers may not be in too much of a hurry to lock down spot volumes given the circumstances and the position of buyers to lift more contract LNG as the new trains emerge.
Russia and Turkey’s Gas Price Dispute
Russian Gazprom reduced daily natural gas supplies to Turkey by around 50 percent from Feb. 10 along the western line. The company decided to reduce its natural gas flow after a price dispute with private buyers in Turkey. Earlier it was reported that Gazprom, which was in discussions with six Turkish private companies on Jan. 29, cancelled the 10.25 percent discount applied on natural gas supplies from Gazprom from Jan. 1 this year.
Platts
U.S. Natural Gas Production Set a Record High in February
Mar. 22
Natural gas production in the lower 48 United States averaged 73.3 billion cubic feet per day (Bcf/d) in February, which is up nearly 1.4 Bcf/d, compared to the January average, according to Platts Bentek, an analytics and forecasting unit of Platts. This is the highest production on record since Platts Bentek began tracking the data in 2005. On a month-over-month basis, February natural gas production was up nearly 2 percent from January.
“The natural gas production record achieved in February is largely attributed to the Northeast, which also is still helping offset the declines seen in other major U.S. basins,” said Sami Yahya, Platts Bentek energy analyst. “A combination of adequate demand and lack of freeze-offs helped producers push their production volumes to new highs. Typically, the month of February is impacted considerably every year with a bout of freeze-offs, but this year the cold temperatures did not linger long enough to cause meaningful impact.”
Northeast gas production reached nearly 23.1 Bcf/d in February, rendering an average of 22.7 Bcf/d for the month. This average was about 0.8 Bcf/d greater than the January average and about 1.5 Bcf/d more than the December 2015 average. For basins outside the Northeast, the February average was nearly flat or slightly declining from the previous month.
“While the number of active rigs in the Northeast is currently at its lowest historically, the availability of inventory wells is helping producers keep their production numbers leveled,” Yahya noted. “We track the number of drilled-but-uncompleted wells in the Northeast monthly. Based on the latest numbers, the number of inventory wells has been declining steadily since November of 2015, which is a signal the producers are dipping into their inventory more than ever.”
Prior to November of 2015, the Northeast had about 2700 wells in backlog inventory, whereas in January of this year, the number is barely more than 2000 wells.
“The Utica is the only place in the Northeast where the inventory numbers are not taking a steep dive,” said Yahya. “The big focus now within the Utica is the drier areas, where the initial production rates of new wells are incredibly high. This means you do not need to bring online as many wells to help keep production afloat.”
Platts Bentek data analysis suggests 2016 U.S. natural gas production will average approximately 71.6 Bcf/d, with some growth geared toward the end of the year. This will mark a year-on-year decline of less than 1 percent.
The Bentek data analysis is based on an extensive sample of near real-time production receipt data from the U.S. lower 48 interstate pipeline system. Platts’ Bentek production models are highly correlated with and provide an advance glimpse of federal government statistics from the U.S. EIA.
This Bentek Energy U.S. natural gas production data estimate will be published every month covering the previous month’s output activity. Bentek’s dry gas production estimates are not observed data and are based on pipeline receipt nominations and certain state production data.
Bentek Energy, which specializes in energy market analytics and is recognized as the industry leader in natural gas market fundamental analysis, was acquired by Platts in 2011. For more information about natural gas spot price trends, or Platts, a leading global energy, petrochemical and metals information provider, visit the website at www.platts.com.


