Where we share some O&G news from beyond the Permian’s borders—news that, in some way, touches the Basin.
EIA
Apr. 25
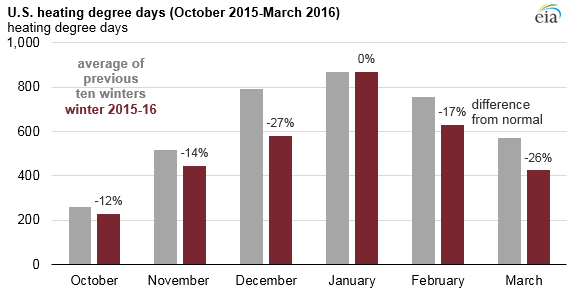
Above-normal temperatures during the 2015-16 winter were a key factor in lowering heating demand and winter fuel expenditures. Compared with the 2014-15 winter, propane and heating oil demand decreased by 16 percent and 45 percent, respectively, and residential electricity demand decreased by 6 percent. The 2015-16 winter season (October through March) was 15 percent warmer than last winter, driven in part by one of the strongest El Niño events in decades.
Apr. 20
In response to continued low oil prices, onshore crude oil production in the lower 48 states is expected to decline from an average of 7.41 million barrels per day (b/d) in 2015 to 6.46 million b/d in 2016 and to 5.76 million b/d in 2017. Increased production from the federal Gulf of Mexico (GOM) is not enough to offset those declines, with total projected U.S. production falling from 9.43 million b/d in 2015 to 8.04 million b/d in 2017.
Apr. 19
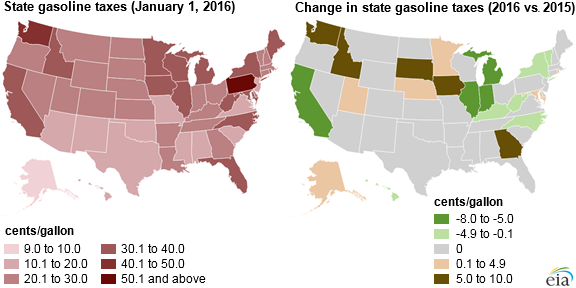
State-level taxes and fees on gasoline in the United States averaged 26.5 cents per gallon (¢/gal) as of Jan. 1, 2016. These taxes and fees ranged from a low of 8.95¢/gal in Alaska to a high of 51.4¢/gal in Pennsylvania, in addition to the federal tax of 18.4¢/gal. State taxes on diesel are slightly higher—averaging 27.4¢/gal, and ranging from 8.95¢/gal in Alaska to 65.1¢/gal in Pennsylvania—and are in addition to the 24.4¢/gal federal tax. EIA collects information on state gasoline and diesel fuel taxes twice a year, and recently released data for state tax rates in effect as of Jan. 1, 2016.
Apr. 18
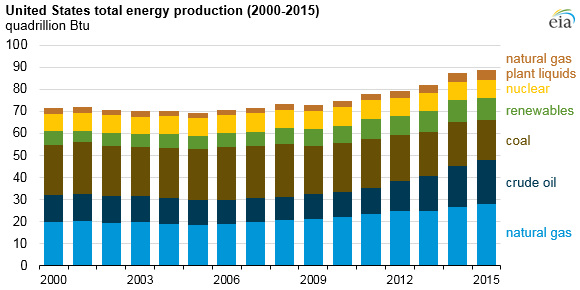
Total U.S. energy production increased for the sixth consecutive year. According to data in EIA’s most recent Monthly Energy Review, energy production reached a record 89 quadrillion British thermal units (Btu), equivalent to 91 percent of total U.S. energy consumption. Liquid fuels production drove the increase, with an 8 percent increase for crude oil and a 9 percent increase for natural gas plant liquids. Natural gas production also increased 5 percent. These gains more than offset a 10 percent decline in coal production.
Apr. 12
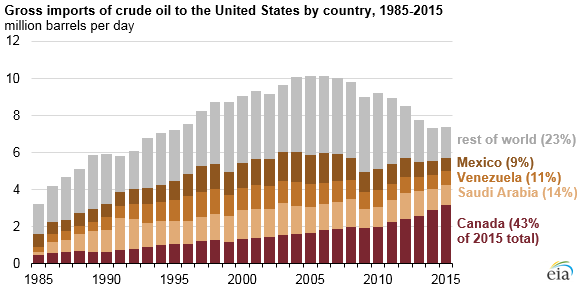
Although total U.S. crude oil imports in 2015 continued to be lower than levels reached during the mid-2000s, imports from the United States’ top foreign oil supplier—Canada—were the highest on record, according to annual trade data from EIA’s Petroleum Supply Monthly. Canada provided 4 out of every 10 barrels of oil imported into the United States in 2015.
EIA Administrator Adam Sieminski issued the following comments on the new STEO and summer fuels forecast:
Gasoline/Refined Products:
“U.S. drivers are expected to pay the cheapest summer gasoline prices in 12 years, as low crude oil prices mean more savings at the pump.”
“Low pump prices and continuing growth in employment contribute to more driving, resulting in a forecast of record high gasoline demand this summer.”
“For all of 2016, the average household will save about $350 on gasoline purchases compared to last year.”
“The United States started the spring and summer driving season with gasoline inventories nearly 15 million barrels higher than last year.”
Crude Oil:
“U.S. crude production is expected to drop an additional 100,000 barrels per day more than previously forecast for both this year and in 2017, as output declines further from 2015’s level, which was the highest since the early 1970s.”
“While U.S. onshore oil production is forecast to decline, oil output in the Gulf of Mexico is on track to increase.”
“The United States will account for most of the decline this year in global non-OPEC production, which is expected to drop for the first time in eight years.”
“Global petroleum demand is expected to increase by over 1 million barrels per day in both this year and in 2017.”
Natural Gas:
“U.S. natural gas inventories just finished the winter heating season at their highest level ever, and are expected to be at a record high at the start of next winter heating season in November.”
“This summer natural gas consumption for electricity generation is expected to reach a record high.”
Electricity:
“With cooler temperatures forecast for this summer compared to last year, households in some regions are expected to have slightly lower power bills.”
“There will more electricity generated this year by natural gas, solar energy, and wind and less by coal-fired power plants.”
Coal:
“Coal use in the electric power sector is expected to decline this year because of mild winter and summer weather and more generation from natural gas and renewables.”
Renewables:
“The U.S. power sector will use more renewables this year to generate electricity, with hydropower, solar, and wind power combined growing about 11 percent.”
Apr. 11
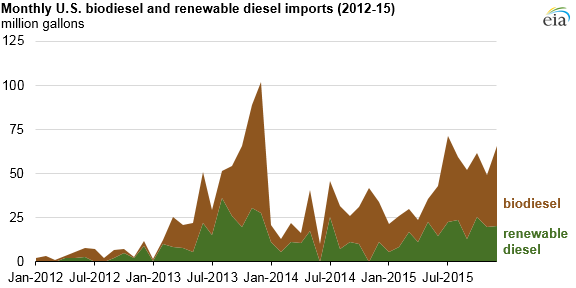
After reaching its highest level to date in 2013, U.S. imports of biomass-based diesel fuel (both biodiesel and renewable diesel) fell in 2014 amid uncertainty surrounding future Renewable Fuel Standard (RFS) targets and the elimination of the biodiesel blender’s tax credit. As higher targets for biomass-based diesel were finalized in 2015, U.S. imports of biodiesel and renewable diesel increased by 61 percent in 2015 to reach 538 million gallons.
Apr. 7
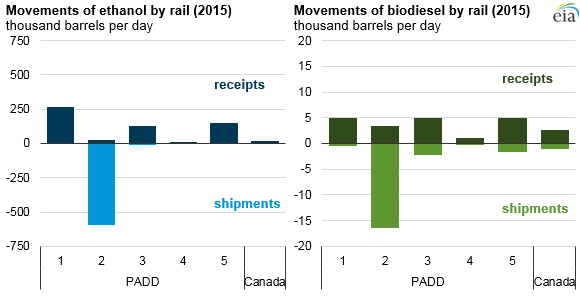
In 2015, the ethanol share of gasoline was 9.9 percent, and the biodiesel share of distillate was 2.4%. Most ethanol and biodiesel is produced in the Midwest (PADD 2), where it is then shipped to other regions. In 2015, the Midwest shipped 593,000 barrels per day (b/d) of ethanol by rail and 16,000 b/d of biodiesel by rail. The East Coast (PADD 1) receives almost half of the ethanol moved by rail. Biodiesel by rail receipts are about the same in all regions except the Mountain region (PADD 4).
Apr. 6
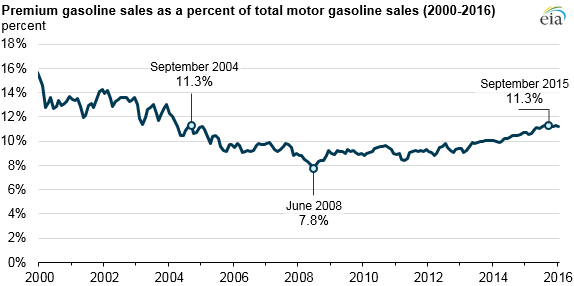
Since 2013, the share of premium gasoline in total motor gasoline sales has steadily increased to 11.3 percent in August and September 2015, the highest share in more than a decade. Although lower gasoline prices may be supporting demand for premium gasoline, the upward trend in sales is more likely driven by changes in fuel requirements for light-duty vehicles (LDV) in response to increasing fuel economy standards, which will have widespread implications for future gasoline markets.
Platts
Platts Adds Natural Gas Liquids to its Forward Curves
Platts, the leading independent provider of information and benchmark prices for the commodities and energy markets, on Apr. 13, announced that it has expanded its commodity risk solutions to include natural gas liquids (NGLs) for three delivery locations in the United States: Mont Belvieu Lone Star (LST), NGL pipeline, and Mont Belvieu non-LST, in Texas, and Conway, Kan.
Platts mark-to-market (M2M) NGL forward curves are quantitatively derived; based on Platts NGL editorial market pricing expertise; and provide insight into the current price for contract delivery up to 36 months forward. The forward curves help NGLs producers, traders, brokers, and end users make better production, hedging, and risk management decisions and also facilitate fair-value measurement accounting requirements.
Stuart Wood, vice president of commercial products at Platts, said, “We are committed to providing our customers with an independent, transparently produced source of NGL forward curves that will help them measure their assets at fair value and manage their business in volatile times.”
Twelve customers in the United States, spanning exploration and production to midstream and downstream oil companies with NGL exposure, have already signed on to use Platts NGL forward curves for valuation purposes.
Platts’ M2M NGL coverage includes propane, ethane, ethane/propane (E/P) mix, butane, isobutane and natural gasoline. The M2M NGL forward curves are quantitatively derived from a combination of Platts oil price assessments and Platts proprietary analytics capabilities, together with additional forward curve data from the Intercontinental Exchange (ICE).
Kwhame Gittens, Platts manager of commodity risk solutions-Americas, said: “Based on the Platts M2M NGL forward curves, consumers of ethane and propane could ask themselves whether they should be buying ahead in the current environment. Conversely, producers may be assessing whether they should hold on and wait for higher prices.”
For example, the NGL forward curves indicate that the cost of non-LST ethane for 2018 delivery will average 26.22 cents per gallon (/gal). But forecast models, including those of Platts Bentek, an analytics and forecasting unit of Platts, predict ethane prices of around double that in 2018, particularly as new steam crackers come online, increasing ethane recovery outside the U.S. Gulf.
The M2M NGL forward curves U.S. delivery locations:
- LST: reflects prices of NGLs for transmission on the Lone Star NGL pipeline.
- Non-LST: reflects prices of NGLs for transmission on the other terminals within Mont Belvieu.
- Conway, Kan., located in the heart of the Midwest, is home to another key NGL production and storage facility. Conway serves as the hub for the Midwest, feeding much of the region’s need for agricultural crop drying and residential heating.
For more information on the Platts M2M-NGL forward curves model, visit http://www.platts.com/products/m2m-ngl-forward-curves.
Through its commodity risk solutions, Platts provides clients with a full and independent view of forward price assessments for oil, NGLs, petrochemicals, natural gas, power, and coal around the world. In addition to more than 400 forward curve price assessments, Platts publishes more than 20,000 benchmark price assessments, references, and indexes in energy, petrochemicals, metals, and agriculture on a daily basis.


