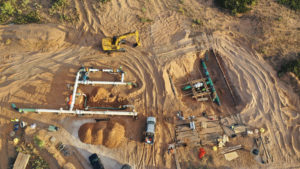
The year 2019 will be remembered as Midstream’s Year.
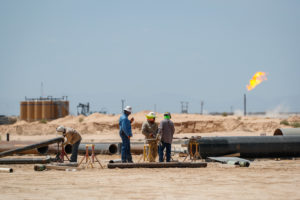
Pipeline construction near Pecos, August 21, 2019.
Photo Credit: James Durbin / The Oilfield Photographer, Inc.
As we near year-end in what might be the most eventful year ever in Permian midstream activity,
we look at two kinds of snapshots. One, some recent graphics highlighting the impact of a record amount of completed pipeline construction. And two, some literal snapshots—high resolution images showing what the work looks like in three representative efforts in this buildout for the ages.
For the first, our friends at Enverus have some fresh and insightful analysis on the current conditions in midstream.
Crude Flows Unconstrained on New Pipelines
The first accompanying chart shows local refining and takeaway capacity from the Permian Basin vs. Permian production under two price scenarios: NYMEX WTI strip (close 9/22/2019) and WTI at $70/Bblstarting 1/1/2020.
The possibility of seeing a flat $70/bbl outlook is increasingly distant due to slowing global demand growth, although rising geopolitical tensions could provide some upside. Nevertheless, Enverus’ modeling demonstrates that not even $70/bblwill fill all the capacity coming online before the end of 2025. 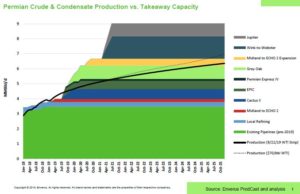
In the near term, pressure will continue to come off the Midland basis. Indeed, Midland WTI has been trading at premiums to Cushing thanks in large part to the startup of Cactus II and EPIC this summer.
Staging linefill for Gray Oak is quickly approaching, and this should give further support to prices at Midland if local inventories get tight.
As barrels begin to flow on committed pipeline space, uncommitted shippers on legacy pipeline systems will be squeezed as arbs tighten. Walk-up tariff compression is already underway.
Map Says It All
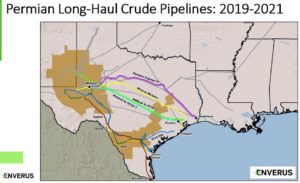 As Enverus’ map indicates, the tremendous shift in new pipeline projects going to the Gulf Coast, direct from the Permian, rather than to Cushing, Okla., means a “sea change,” literally, for the way things are done. Exports rule in this brave new world of shale development.
Incremental supplies will head to the Gulf at the expense of Cushing, where stocks will likely continue drawing until offset by lower refinery crude demand turning October-November turnarounds.
Permian Gas Production Versus Takeaway
Lastly, we come to the graph (again by Enverus) that plots Permian production as it relates to takeaway capacity for natural gas. This dynamic holds much interest because both variables are indeed that—variable. Both factors are in flux. Permian production is consistently on the rise. And midstream capacity, while it has had this huge year of project completions, is still on the rise as well.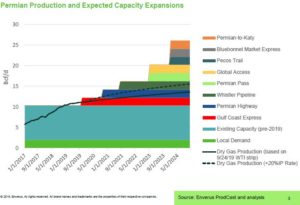
Permian gas production growth has been testing the limits of takeaway capacity. Flaring has been an outlet and finally the first pipeline starts services: Kinder Morgan’s Gulf Coast Express. However, this relief would be temporary as the constraint is expected to return in early to mid 2020.
Multiple projects have been proposed to add takeaway capacity, including some that have already reached FID. Currently, the only project under construction is Permian Highway, which is expected to come online at the end of 2020.
And the Photos
In our photo gallery of midstream triumphs, we see projects as they appeared in recent weeks at Wink, Kermit, and Pecos. While prices for crude and natural gas have not been kind to our region’s producers, the industry itself has stepped up in so many ways to equip this country to not only make itself energy independent, but to make it a supplier to the world. The efforts and initiative of the midstream sector—especially now, in these days of burgeoning activity—will profit the United States for decades to come.


