Where we share some O&G news from beyond the Permian’s borders—news that, in some way, touches the Basin.
Energy Information Administration (EIA)
May 23
The United States remained the world’s top producer of petroleum and natural gas hydrocarbons in 2015, according to U.S. Energy Information Administration estimates. U.S. petroleum and natural gas production first surpassed Russia in 2012, and the United States has been the world’s top producer of natural gas since 2011 and the world’s top producer of petroleum hydrocarbons since 2013.
May 18
Angola is the second-largest oil producer in sub-Saharan Africa, behind Nigeria. The country experienced an oil production boom between 2002 and 2008 when production started at several deepwater fields… Angola has been the second-largest supplier of crude oil to China since 2005, behind Saudi Arabia. The United States, the European Union, and India are also major destinations for Angolan oil. However, U.S. imports of Angolan crude oil continue to decline because of increased U.S. production of similar-quality crude grades.
May 12
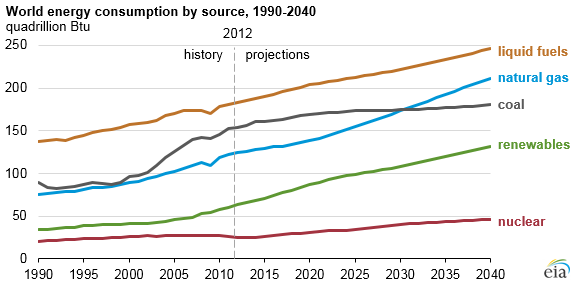
The U.S. Energy Information Administration’s recently released International Energy Outlook 2016 (IEO2016) projects that world energy consumption will grow by 48 percent between 2012 and 2040. Most of this growth will come from countries that are not in the Organization for Economic Cooperation and Development (OECD), including countries where demand is driven by strong economic growth, particularly in Asia. Non-OECD Asia, including China and India, accounts for more than half of the world’s total increase in energy consumption over the projection period.
EIA estimates that oil sands output fell in recent days by as much as 1.0 million b/d, as wildfires reached Fort McMurray, Alberta, the center of Canadian oil sands industry. Consequently, EIA expects that second-quarter 2016 Canadian oil sands production will be reduced significantly. Depending on the extent of damage, production outages could carry forward into summer… Canada’s production in the second quarter of 2016 will fall by an average of 0.5 million b/d from first-quarter levels before rebounding in the third quarter.
May 11
Developing economies in Asia lead projected growth in world energy use
World energy consumption is projected to increase by 48 percent over the next three decades, led by strong increases in the developing world—especially in Asia, according to International Energy Outlook 2016 (IEO2016), released today by the U.S. Energy Information Administration (EIA).
Rising incomes in China, India, and other emerging Asian economies are a key driver of the global energy outlook. “Developing Asia accounts for more than half of the projected increase in global energy use through 2040.” said EIA Administrator Adam Sieminski. “This increase will have a profound effect on the development of world energy markets.”
Clean energy technologies play an important role in the outlook, with renewables expected to be the fastest-growing energy source.
IEO2016 presents updated projections for world energy markets through 2040. Outside of the United States, projections are based on current laws, regulations, and announced policies, where such indicators have historically been reliable guides. For the United States, the projections are generally based on existing laws and regulations but do not include the effects of the recently finalized Clean Power Plan (CPP) regulations. Published EIA analysis of the proposed version of the CPP shows potential significant reductions in U.S. coal consumption and increases in U.S. renewable consumption. Text, tables, and figures throughout IEO2016 address the CPP where it causes results to differ significantly from those in the IEO2016 Reference case.
Some key findings:
World energy use increases from 549 quadrillion British thermal units (Btu) in 2010 to 815 quadrillion Btu in 2040. The increase mainly occurs in the developing world, driven by long-term growth in economies and populations. More than half of the total world increase in energy consumption is attributed to developing Asia.
IEO2016 projects renewables as the world’s fastest-growing energy source—increasing by 2.6 percent per year through 2040—but fossil fuels still supply more than three-quarters of world energy use. Although petroleum and other liquids remain the largest source of energy, the liquid fuels share of world-marketed energy consumption falls from 33 percent in 2012 to 30 percent in 2040.
Natural gas is the fastest-growing fossil fuel in the outlook. Global natural gas consumption grows by 1.9 percent per year. Abundant natural gas resources and robust production—including rising supplies of tight gas, shale gas, and coal bed methane—contribute to the strong competitive position of natural gas. Coal is the world’s slowest-growing energy source, rising by 0.6 percent per year through 2040. By 2030, natural gas surpasses coal to become the world’s second-largest energy source after liquid fuels.
Other IEO2016 highlights:
- By 2040, coal, natural gas, and renewable energy sources provide roughly equal shares (28-to-29 percent) of world electricity generation—a significant change from 2012, when coal provided 40 percent of all power generation. Hydropower and wind are the two largest contributors to the increase in world electricity generation from renewable energy sources, together accounting for two-thirds of the total increase from 2012 to 2040. Hydropower and wind generation each increase by about 1.9 trillion kilowatthours (kWh) in the IEO2016 Reference case.
- Throughout the projection, the top three coal-consuming countries—China, the United States, and India—together account for more than 70 percent of the world’s coal use. China currently accounts for almost half of the world’s coal consumption, but a slowing economy and plans to implement policies to address air pollution and climate change contribute to declining coal use in China in the later years of the projection. Inclusion of the CPP substantially lowers coal use in the United States from the level projected in the IEO2016 Reference case. Of the world’s three largest coal consumers, only India is projected to increase coal use throughout the projection period.
- Worldwide electricity generation from nuclear power increases from 2.3 trillion kWh in 2012 to 4.5 trillion kWh in 2040, as concerns about energy security and greenhouse gas emissions support the development of new nuclear generating capacity. Virtually all of the projected net expansion in the world’s installed nuclear capacity occurs in the developing world, led by China’s addition of 139 gigawatts of nuclear capacity from 2012 to 2040.
- The industrial sector continues to account for the largest share of delivered energy consumption, using over half of global delivered energy in 2040.
- Worldwide energy-related carbon dioxide emissions rise from 32 billion metric tons in 2012 to 36 billion metric tons in 2020 and then to 43 billion metric tons in 2040, a 34 percent increase from 2012 to 2040.
IEO2016 is available at http://www.eia.gov/forecasts/ieo/
May 10
During the first three months of 2016, crude oil prices were relatively more volatile than in recent history. This elevated volatility occurred when overall oil prices were low, and volatility was driven by high uncertainty related to supply, demand, and inventories. Crude oil price volatility has declined since its peak in March. Prices have risen as concerns about future economic growth have abated and as inventory growth has slowed since the start of the year.
EIA Administrator Adam Sieminski issued the following comments on the new monthly STEO forecast:
Gasoline/Refined Products:
“Rising crude oil prices are likely to be passed on to consumers at the pump, but U.S. drivers are still expected to pay the lowest summer gasoline prices since 2004, and for all of 2016, the average household will spend $900 less on gasoline than it did two years ago.”
Crude Oil:
“U.S. crude oil production in 2017 is expected to be more than 100,000 barrels per day higher than previously forecast in response to higher oil prices.”
“Higher oil demand in China and India will contribute to a drawdown in global oil inventories during the second half of 2017.”
Natural Gas:
“Low natural gas prices may slow the growth in U.S. natural gas production for the next few months.”
“Big builds in U.S. natural gas inventories are expected during the months ahead, leaving inventories at a record high at the start of the heating season in November.”
Electricity:
“The annual amount of electricity generated by natural gas will exceed the generation from coal-fired power plants this year for the first time.”
“Coal-fired electricity generation will be 8 percent lower this year, while natural gas generation will increase by 4 percent.”
Coal:
“High natural gas production and low natural gas prices are making coal a less competitive generating fuel for many U.S. power plant operators.”
“U.S. coal production this year is expected to have the biggest volume decline in almost seven decades.”
Renewables:
“Wind power will account for almost 6 percent of U.S. total electricity generation in 2017.”
“Ethanol’s share of U.S. gasoline will average 10 percent this year and in 2017.”
May 6
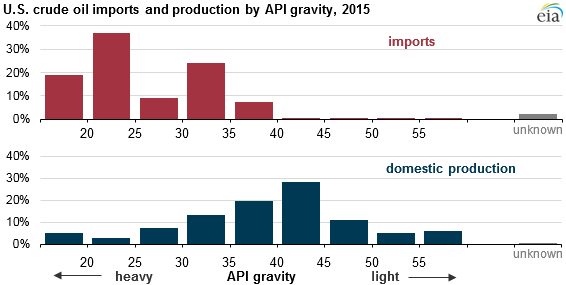
In 2015, more than 70 percent of the crude oil produced in the Lower 48 states was light oil with an API gravity above 35 degrees. At the same time, 90 percent of imported crude oil was heavier, with a gravity below 35 degrees API. To accommodate increasing U.S. production of light crude oil, refineries have adjusted their imports by reducing imports of light crudes. The differences between domestic production and imports in this key oil characteristic could bring changes to petroleum refinery operations in the United States.
May 4
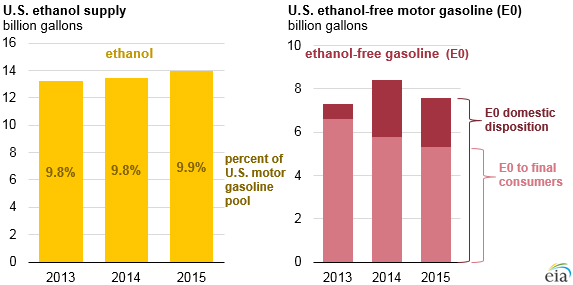
Blends of petroleum-based gasoline with 10 percent ethanol, commonly referred to as E10, account for more than 95 percent of the fuel consumed in motor vehicles with gasoline engines. Ethanol-blended fuels are one pathway to compliance with elements of the federal renewable fuel standard (RFS). The total volume of ethanol blended into motor fuels used in the United States has continued to increase since 2010, albeit at a declining rate of growth… With nearly all U.S. gasoline now being sold as E10, the only way to increase ethanol use in the motor vehicle fleet is to adopt fuel blends containing a higher volume of ethanol, such as E15 and E85. However, not all gasoline-powered vehicles can use these fuels.
May 3
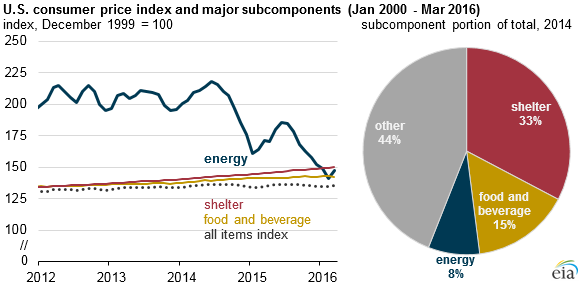
Since June 2014, decreases in crude oil and natural gas prices have reduced household energy costs. According to initial figures from the U.S. Bureau of Labor Statistics (BLS), the chained consumer price index for urban consumers (C-CPI-U) decreased by 1.2 percent from June 2014 to February 2016. Lower energy prices had a significant impact on this decrease in spite of increases in the food and shelter components of the overall index, which represent larger shares of household expenses.
April 28
Iraq is OPEC’s second-largest crude oil producer and holds the fifth-largest proved crude oil reserves in the world. In 2015, Iraq’s production increased by almost 700,000 b/d compared with the production level in 2014, representing the largest year-over-year increase since Iraq’s production recovery in 2004, following the start of the Iraq war… Iraq continues to lower its ambitious oil production targets… After lowering the target to about 9.0 million b/d by 2020, Iraq may lower the target down to 6.0 million b/d if oil prices continue to be low.


