


After a bumpy first half, the year 2025 has put the Permian Basin’s oilfield services (OFS) sector squarely in the squeeze. Crude and gas prices have softened from 2023–24 highs, leaving exploration and production (E&P) budgets tighter, drilling schedules leaner, and pricing power tilting back toward operators. Yet this is also a cycle of reinvention: productivity remains exceptional, capital discipline is unlocking niche opportunities, and service companies that pivot toward efficiency and through-cycle offerings are finding room to run.
Prices that Pinch—and the Capex Chill They Create
Benchmark prices set the tone. West Texas Intermediate (WTI) has hovered in the mid-$60s lately, with consensus pointing to flat-to-lower averages into year-end as inventories build and OPEC+ supply grows. That’s enough to pressure short-cycle shale spending: when strips drift toward the low-$60s, the first reflex among Permian operators is to slow drilling and especially completions. Public forecasts echo this caution, with analysts expecting subdued 2025 averages and the U.S. Energy Information Administration (EIA) projecting weaker prices into early 2026 as stocks accumulate. Reuters and the EIA Short-Term Energy Outlook both signal that supply growth is outrunning demand near-term. ReutersU.S. Energy Information Administration
Natural gas hasn’t provided much relief. Henry Hub has been range-bound and volatile, with shoulder-season softness offset only sporadically by weather and LNG maintenance windows. Lower liquids realizations and weak NGL differentials in stretches of 1H25 further pinched cash flows for gassier operators—another nudge toward capital restraint. The EIA’s recent market updates and STEO figures capture that push-and-pull between soft prices and still-resilient supply. EIA STEO. U.S. Energy Information Administration

Activity Meters are Blinking Yellow
You can see the slowdown most clearly in activity metrics. The U.S. rig count is off year-over-year, and the Permian has not been immune. Weekly rig tallies and completion-crew (“frac spread”) counts show fewer crews at work than earlier in the cycle, reflecting E&P belt-tightening and a preference to live within cash flow. The industry’s bellwethers—Baker Hughes for rigs and Primary Vision for spreads—both show 2025 levels below last year’s reads. Baker Hughes rig count and Primary Vision frac spread count. Baker Hughes Rig CountAmerican Oil & Gas Reporter
The Dallas Fed’s most recent Energy Survey, a bellwether for the Eleventh District (which covers the Permian’s Texas and New Mexico footprint), reported a slight contraction in activity in Q2 as uncertainty rose and costs remained sticky. In plain terms: operators are doing more math before green-lighting new work; service providers feel it in bid intensity, shorter backlogs, and slower pricing. Dallas Fed Energy Survey. Federal Reserve Bank of Dallas
Where it Hurts for OFS
- Pricing concessions and utilization drift.As rigs and spreads step down, dayrates and service prices face renewed pressure. Subscale pressure pumpers, wireline firms, and smaller workover outfits feel this first when utilization slides below the threshold needed to cover crews and maintenance.
- Inventory overhang in consumables.With fewer stages pumped and wells completed, demand for sand, chemicals, and tubulars softens, stressing distributors and last-mile logistics providers that expanded in 2023–24.
- Working-capital crunch.Slower turns and sharper bid competition stretch receivables. For private OFS firms without low-cost credit, that can choke reinvestment right when fleets need refurb cycles.
- Customer concentration and schedule volatility.Consolidation among Permian operators—plus the rise of “manufacturing mode” development—means bigger but lumpier pads. A slipped frac date can idle an entire spread; a delayed tie-in pushes out production-chem demand.
These dynamics align with global commentary from large caps, too: SLB, for example, flagged risk of lower upstream spending in 2025 led by North America weakness—an early top-down tell that filters straight to Permian OFS. SLB Q2 2025 results and Reuters coverage. Investor CenterReuters
The Bright Spots (They’re Real)

- Productivity keeps improving.Even as the rig count eases, output resilience has been remarkable thanks to longer laterals, optimized spacing, and higher-intensity completions. The EIA continues to highlight productivity gains as a key reason U.S. crude reaches cycle highs in late 2025 before moderating. For OFS, that favors specialists who enable bigger stages, cleaner frac fleets, and faster cycle times. EIA STEO. S. Energy Information Administration
- Through-cycle services are in demand.Production-optimization, artificial-lift upgrades, flow assurance, metering, water management, and integrity work all remain comparatively steady even when new-well activity softens. The Permian’s massive base production requires constant care; OFS firms with strong production-services portfolios are leaning in.
- Niche tech and lower total cost of ownership (TCO).Digital field ops (automated pressure control, wireline telemetry, predictive maintenance), grid-connected or dual-fuel frac fleets, and smarter last-mile sand logistics can demonstrably lower cost/BOE. In a flat-price world, anything that tightens “feet per day,” reduces NPT, or cuts fuel burn wins share.
- Capital discipline as a catalyst.With E&Ps prioritizing free cash flow, they’re receptive to contract structures that align incentives: performance-based pricing, multi-well integrated packages, and uptime guarantees. Well-documented value props can support margins even when headline dayrates soften.
What Smart OFS Strategies Look Like Now
- Pivot to completion efficiency.Prioritize fleets and crews that shorten stage times and maximize pumping hours. Tie equipment packages to measurable outcomes (stages/day, fuel/stage, emissions) so operators see the TCO delta. Evidence from Primary Vision’s spread counts and operator anecdotes shows completions are the swing lever in 2025; being the “can’t-cut” crew matters most. Primary Vision. American Oil & Gas Reporter
- Lean into base-production care.Expand chemical programs, saltwater disposal optimization, and artificial-lift redesigns that stabilize decline rates. Even in a cautious capex environment, operators protect base barrels first—a steadier revenue stream for service companies that excel here. Dallas Fed survey responses underscore the bid for cost certainty amid uncertainty. Dallas Fed. Federal Reserve Bank of Dallas
- Selective consolidation and partnerships.In segments with too many near-identical offerings (e.g., smaller pumpers, commodity logistics), scale improves asset utilization and parts procurement. Partnerships with midstream and water-infrastructure players can also create more defensible, multi-year revenue.
- Scenario-proof your balance sheet.Bake mid-$50s WTI into downside planning. Maintain capex flexibility (rebuilt vs. new iron, lease-vs-buy for power gen), and lock in term contracts where possible. Public forecasts from Reuters’ analyst polls and EIA’s STEO make the case for caution on price—plan operations accordingly. Reutersand EIA STEO. ReutersS. Energy Information Administration
Why the Permian still offers opportunity
Even with fewer rigs and spreads, the basin’s depth of inventory, stacked pay, and infrastructure (pipelines, power, sand, water) make it the world’s premier short-cycle oil province. The EIA’s regional data and historical price series show two truths that matter for OFS: (1) activity is highly price-sensitive, and (2) the Permian adapts faster than anywhere else—both on the way down and on the way up. That means service providers positioned for speed and efficiency can capture outsized volume when prices stabilize or rebound. EIA WTI price history and EIA drilling/production resources. U.S. Energy Information Administration+1
A hopeful note: The 2020s have been hard, but not all hope is lost. The same forces that make 2025 painful—discipline, efficiency, and data-driven development—are also laying the groundwork for a more durable cycle. In the Permian, productivity gains are structural, not cyclical; the base is larger, the toolkits sharper, and the playbook clearer. When prices firm, activity will scale quickly, and the service providers that invested in reliability, technology, and through-cycle value will be first in line.
Sources (linked)
- EIA, Short-Term Energy Outlook: price and activity outlook — https://www.eia.gov/outlooks/steo/S. Energy Information Administration
- Baker Hughes, Rig Count(U.S. and Permian activity indicator) — https://rigcount.bakerhughes.com/Baker Hughes Rig Count
- Dallas Fed, Energy Survey (Q2 2025)— https://www.dallasfed.org/research/surveys/des/2025/2502Federal Reserve Bank of Dallas
- Reuters, Oil price outlook/poll (Aug. 29, 2025)— https://www.reuters.com/business/energy/oil-faces-uphill-struggle-supply-glut-worries-mount-2025-08-29/Reuters
- Primary Vision, S. Frac Spread Count— https://www.aogr.com/web-exclusives/us-frac-spread-countAmerican Oil & Gas Reporter
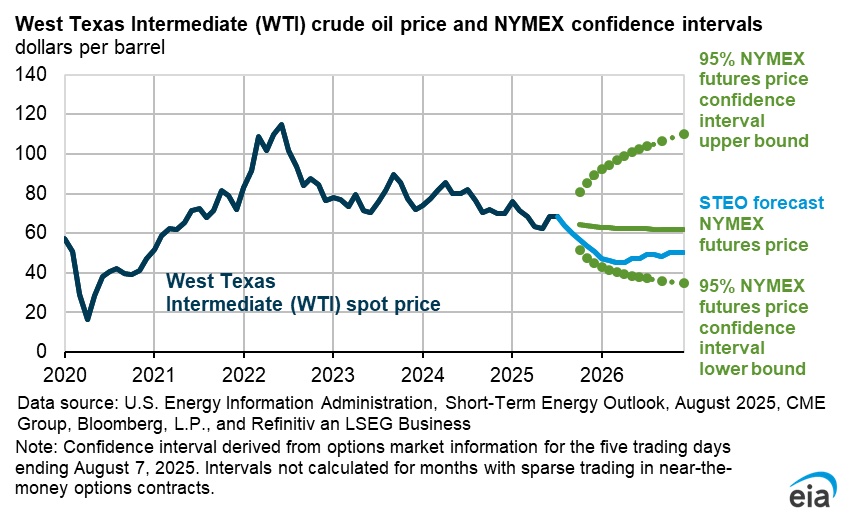
The accompanying chart from the EIA presents the Short-Term Energy Outlook illustrating U.S. crude price dynamics and forecast range. You can also view EIA’s live WTI price history here: https://www.eia.gov/dnav/pet/hist/rwtcm.htm. U.S. Energy Information Administration
By Jesse Mullins, Editor