


A Colorado-based firm released on March 10 the newest version of its mapping and 3D visualization software package with enhanced subsurface viewing capabilities and ease-of-use functionality. The creator, Golden Software, asserts that all users will benefit from the Surfer package’s streamlined map creation, especially those working with drillholes, wells, and other subsurface data. Surfer Product Manager Kari Dickenson said, “In the newest Surfer package, we continue to focus on enabling users to communicate their subsurface 3D data more efficiently and effectively. Geophysicists, geologists, hydrologists, and environmental scientists will find they get better results more quickly from their well and drillhole data.” Surfer is now used by 100,000 professionals worldwide, many involved in environmental consulting, water resources, engineering, mining, oil and gas exploration, and geospatial projects. Its maker says the software has been relied upon for more than 40 years to quickly transform complex data into superior 2D and 3D visuals with accuracy.
Known for its contouring algorithms, Surfer enables users to model data sets, apply an array of advanced analytics tools, and visually communicate the results in a way that even the non-technical stakeholders can understand.
The following upgrades have been made in the latest release of Surfer:
Automatic Surface Creation—Adding to the ability to create contact points for 3D drillholes, Surfer now automatically connects the contacts to generate surfaces of lithologic formations, mineralization zones, and other features. Users have the option of defining each surface as ‘depositional’ or ‘erosional’ to define their cross-cutting relationships.
Import/Export AutoCAD DWG Files—Once only able to support AutoCAD DXF format files, Surfer now imports DWG files which contain all layer information from an AutoCAD model. Each layer can be imported into a separate base layer in Surfer, allowing the user to select and use specific content from the model. This enables Surfer users to load the contents of an AutoCAD model in an organized manner.
Contour and Drillhole Legend Functionality—Users can now add Contour and Drillhole layer to their legends, making maps more meaningful and easier to understand. Contour layers and their colors can automatically be added to the legend in the title block of their Surfer project. In addition, users have complete control over Drillhole layers in the legend even if no symbology is used.
Record 3D Views—For colleagues that do not have Surfer for viewing 3D maps, users can now record a visualization of their models, turning and twisting them to enable a viewer to see the information from many perspectives. The recording can be saved as an MP4 file and sent to a colleague.
Add Labels to 3D Points—In 3D View scatter plots, users can now label points with values from the original data file. Previously, scatter plot point values could be represented in categories by colors or size, but individual data values could not be annotated. Users can now easily present small value changes between individual points on the plot.
Importing Images in 3D View Along a Path—Users can import images, such as geophysical profiles, and set the orientation of the image to a polyline or polygon. There is no need to reference the image by entering corner coordinates; it aligns directly to the polyline or polygon path precisely where it should, even if the profile is not a straight line. This is a huge time saver for a function that was previously a manual process.
Beta Available Now
Golden Software has released a Beta version of Surfer simultaneously with the new version to give customers a chance to try out new features and provide feedback while they are still in development. Users may find the Beta version by clicking File | Online | Try Beta Version from within Surfer.
“Our objective with the Beta features is to give users additional options for collaboration, visualization, and analysis,” said Dickenson.
The new Beta features are available for testing now.
Comments—Users can add comments in Surfer plots, visible to others or only themselves. Comments make it easier to collaborate with colleagues by sharing notes and receiving feedback directly inside the project. This is a major benefit to users who regularly update projects and need to leave reminders on how the map was created or should be changed in the future.
Create a Legend from a Base Layer without Symbology—A popular request from users, Surfer now generates a complete Legend from base layers that do not have applied symbology. The Legend includes all the current properties in the base layer. The user can control which properties are displayed in the legend and their associated names.
3D Grid Filters—To add greater clarity to 3D visualization, Surfer now offers filters to visualizations created from 3D grids to emphasize or hide certain data. The filters refine the visualization to smooth surfaces, fill holes, highlight anomalies, or delete features.
3D Slice Manipulation—Surfer users have been able to make information-rich contour and image slices from their 3D grids in the 3D View, but now they can use the 3D slices in different ways – Save them from the 3D View as an image or grid file and snap their path to a polyline or polygon.
Multiple Clipping Planes—To remove extraneous information, users can clip sections from their 3D block diagrams using up to four planes. Users can change the orientation of each clipping plane along the X, Y and Z axes, creating custom shapes that showcase the important data from their grid.
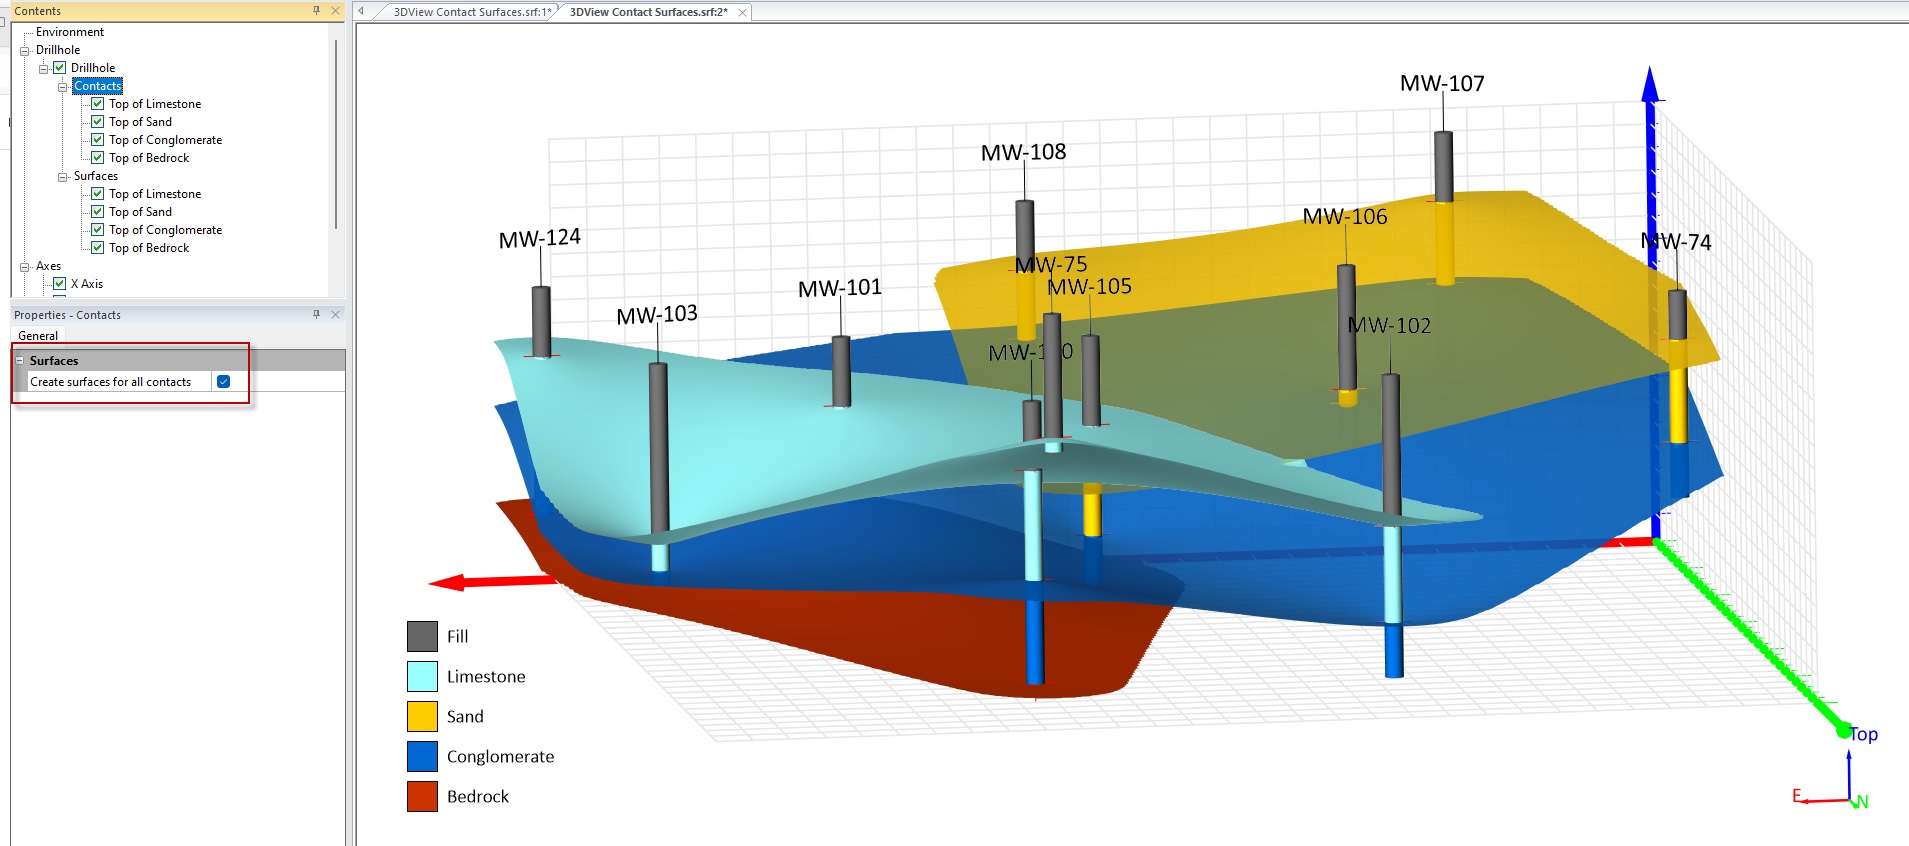
Users of the program can check a box to create surfaces from points of contact in 3D drillhole data.
About Golden Software
Founded in 1983, Golden Software is a developer of scientific visualization software at a great value. Its customer base includes more than 100,000 professionals involved in environmental services, engineering consulting, resource exploration and extraction, applied science, business, education, and government in nearly 190 countries and territories. Golden Software offers two products: Surfer, for gridding, mapping & 3D visualization system and Grapher, for 2D and 3D graphing. Golden Software offers its clients personalized support invested in their success.
For additional information, visit www.GoldenSoftware.com.
Leave a Reply